Using the “Clinician’s Probability Calculator” to calculate Post-Test Probability of Covid-19


Clinician’s Probability Calculator
This calculator is provided as a resource for the article A “Clinician’s Probability Calculator” to convert pre-test to post-test probability of Covid-19, based on method validation from each laboratory” by Zoe Brooks, Saswati Das , Tom Pliura: As stated in the conclusion of the article: “The authors recommend that testing laboratories verify PPA and NPA with sufficient numbers to verify acceptable performance. We hope that laboratory professionals, clinicians and public health professionals will use the Probability Calculator to verify test performance and create reports to help guide clinicians and public health staff with interpretation of the relative probability that positive, or negative, COVID-19 test results indicate an infected person.” Laboratory directors and public health officials who are challenged to select and verify test methods can clearly see the ability of each test to project or rule out Covid-19 infection.
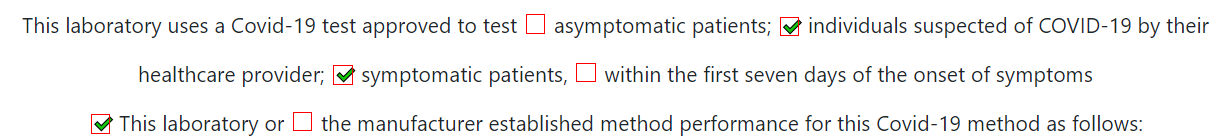
Step 1: The FACT SHEET FOR HEALTHCARE PROVIDERS from each test-kit will specify, for example, this test “is authorized for use with respiratory specimens collected from individuals who are suspected of COVID-19 by their healthcare provider within the first seven days of the onset of symptoms.” Check the appropriate boxes to be sure the person interpreting this report is can compare the authorized use to the clinical situation of each patient.
Step 2: Indicate whether the verification data provided are based on studies conducted by the laboratory or manufacturer.
Just want to ‘make it go?’ Click the button and fill in the blanks.
Enter data from the verification study.
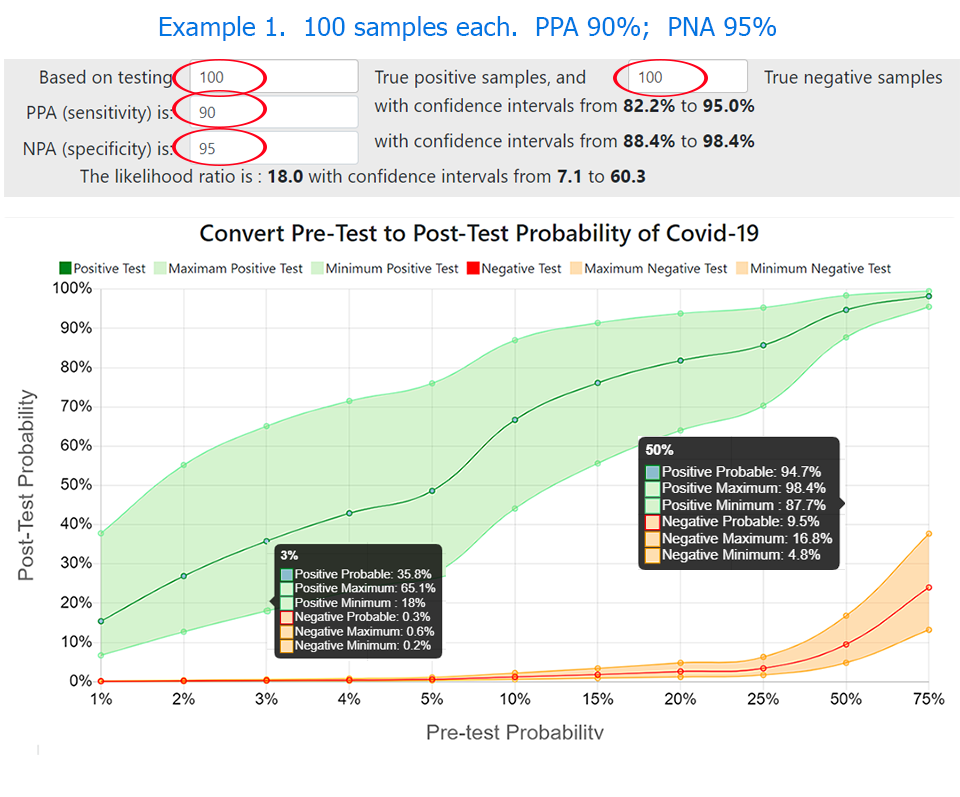
Enter the four numbers in the red ovals: the number of known positive and negative samples tested, plus the observed PPA and NPA. The calculator will display confidence intervals for PPA and NPA, plus the positive likelihood ratio. In the graphic, the x-axis is the pre-test probability, as estimated by the clinician or public health professional. The Y-axis is the post-test probability. The shaded green area shows confidence intervals that a positive Covid-19 test result indicates an infected person. The pale orange shaded area shows confidence intervals that negative Covid-19 test results are false and do indicate an infected person.
Notice in this example that, with a clinical pre-test probability of 3% (as may be seen in an asymptomatic patient with no known contact), the probable post-test probability with a positive test is only 35.8%. If pre-test probability is 50% (as in a symptomatic patient), a positive test produces a probable post-test probability is 94.7%.
A negative test reduces the post-test probability to 0.3% with a clinical pre-test probability of 3%, but only to 9.5% when pre-test probability is 50%.
The range of possible post-test probability with positive and negative test results is driven by the number of samples tested.
Other information provided:
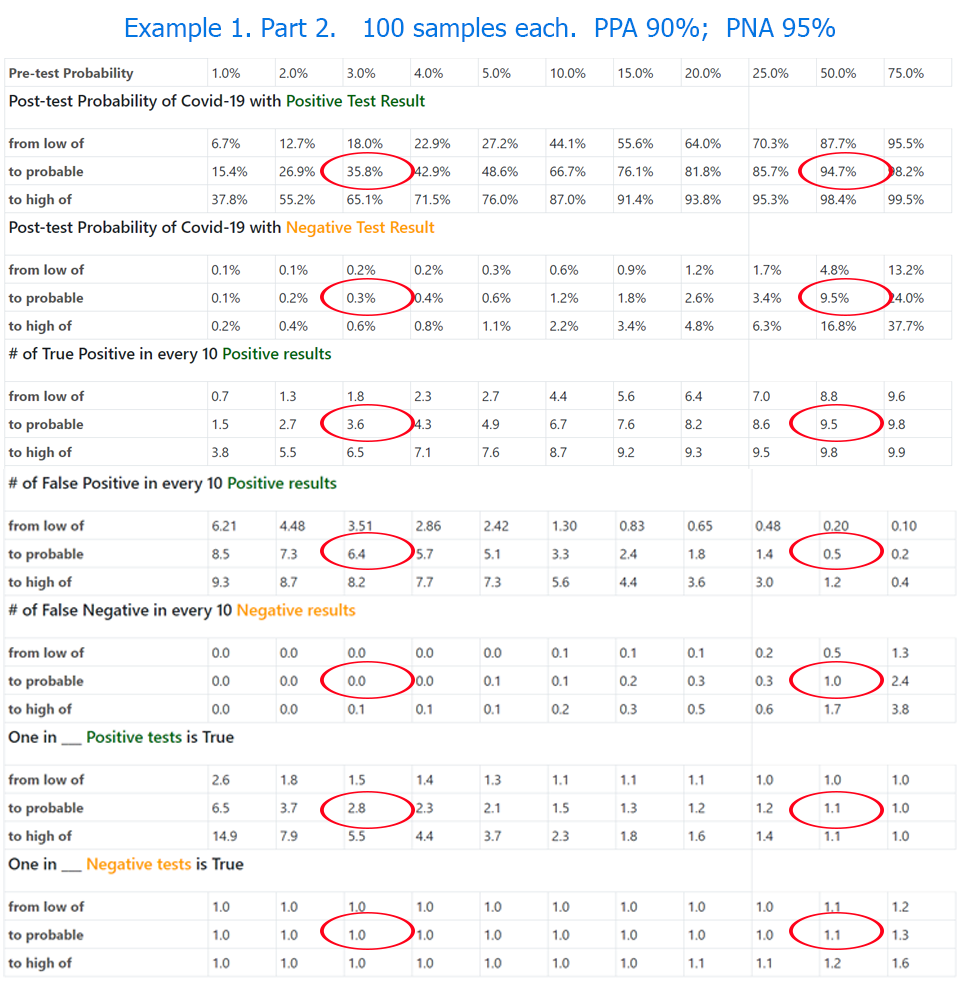
Confidence intervals for the graph and each of the following indicators are driven by PPA and PNA reported, plus the number of samples tested:
- Post-test probability of Covid-19 with positive and negative test result. (This tells the clinician the probability that each patient result from each laboratory indicates SARS-COV2 infection – based on their clinical estimate of pre-test probability.)
- The number of true positive and negative tests in every 10 positive or negative results seen. (Ideally, every test result will be true; with poorer tests or lower confidence limits, users may see only five true results in ten, providing little value to the clinician or patient.)
- The number of false-positive and negative tests in every 10 positive or negative results seen.
- One in ‘x’ positive tests is true, and one in ‘x’ negative tests is True. (Ideally, one in one results will be true; with poorer tests, users may see only one true test in over thirty results, providing little value to the clinician or patient.)
Notice how the numbers circled in red, and the ranges around them, change between the pre-test probabilities of 3% and 50%.
Please use this calculator and share your thoughts.
During the coronavirus pandemic, accurate testing has been a unique and constant challenge for the scientific community. Despite best efforts, false positive and false negative test results are unavoidable. At no time in history has the medical community embarked on a diagnostic testing campaign that is not being pursued for clinical reasons, but instead for epidemiological reasons unrelated to the medical aspects of the illness. Never have so many patient decisions been made, not by the patient’s personal clinician, but by public health employees who may not be clinically trained. With the importance of asymptomatic patients, understanding of the probability of true and false results has never been so critical. This calculator provides a modified application of likelihood ratios to provide practical guidance to the relative probability of true and false results.
Calculator output depends entirely on user input. No warranty is provided or implied.
Send comments and questions to zoe@awesome-numbers.org