
What’s Wrong with the Wrong Mean?
What is wrong with assigning the Mean on QC charts with package insert values, peer group values, ‘True Values’, historical or cumulative values or any number than the recent measured mean?
Quick answer: The purpose of a Quality Control chart is to tell you if your method accuracy or precision changes from its recent performance. If assigned mean values are based on a package insert value, or average of many instruments, or a historical value, they do not reflect recent observed performance. Q.C. charts and rules tell you ‘if Where you ARE is no longer Where you EXPECT to be.’ How can the chart tell you if the mean changes if you do not tell the chart what the mean was to start with?
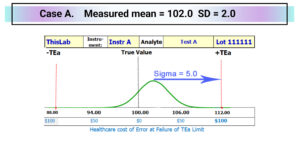
Consider Case A below with a sigma value of 5.0 SD, where sigma is the number of SD between the mean value and the nearest TEa limit. In this case there are 5.0 SD between the current mean of 102.0 and the positive TEa limit of 112.0. Sigma is calculated as ((TEa – |bias|)/SD; in this case sigma = (12.0 – 2.0)/2.0 = 5.0. Sigma is a statistical measure of quality adopted from industry with many shortcomings for effective management of patient risk … but that is a story for another day. For now it is sufficient to know that ISO Guide 31000[i] ISO 31000:2018 Risk management Guidelines “Risk is usually expressed in terms of [A] risk sources, [B] potential events, [C] their consequences and [D] their likelihood.” With the right algorithms sigma can be converted to the likelihood of Medically Unreliable Results. One patient result will fail allowable error in every >1 Million Results. That means that with 100 patient samples per day protected by this QC sample level, one patient result will fail allowable error every >25 Years.
[i] International Organization for Standardization. ISO 31000:2018 Risk management – Guidelines. 4th ed. Geneva: ISO, 2018.
You could look at individual QC sample results on a line chart by setting the True value for the QC sample in the middle and the TEa limits. Risk Evaluation Charts display QC data vs True & TEa where positive results fall above the True value.
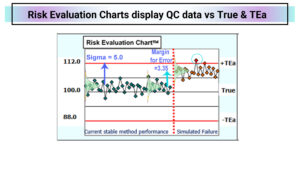
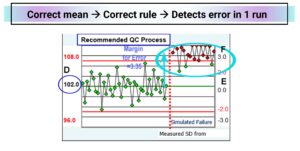
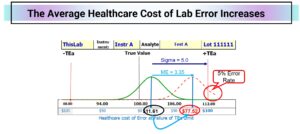
After the red line, the prior 20 points are shifted by 3.35 SD to fail the acceptable risk level. In the example above, one of the twenty results fails after the shift, equivalent to a 5% error rate. Daily QC charts should be designed to detect a failure in a single QC run to alert staff that patients are exposed to unacceptable risks. This method has acceptable risk now; the next step is to meet the CLSI EP23A requirement that “At the least, the ability of the QC procedures to detect medically allowable error should be evaluated.
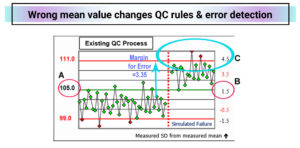
The Existing Q.C. Chart has the assigned mean set at 105 instead of 102 which is 1.5 SD higher than the measured mean. The range of +/- 3SD goes from 99 to 111 (from -1.5 measured SD to +4.5 measured SD from the measured mean. With an intended 1-3s reject rule, there are 3 reject signals before the red line (false positives) while the method is ‘good’, wasting more time and supplies. After the simulated shift of 3.35 SD to cause a 5% failure rate, only two of the twenty results are flagged. On average it would take 10 QC runs to detect failure.
|
Compare QC Strategies |
Existing |
Recommended |
|
Replicates to 1st QC Flag |
10 |
1 |
| Patient results reported before first QC reject flag | 950 |
0 |
|
Number of Medically Unreliable Results reported |
48 |
0 |
|
Average Healthcare Cost of lab error per patient result |
$77.52 | N/A |
|
Healthcare Cost of lab error before first QC Reject Flag |
$73,565 | $0 |
|
Intended QC Rule(s) Applied |
1-3s/2-2s |
1-2.5s |
|
Mean on QC chart |
105.0 | 102.0 |
|
SD on QC chart |
2.0 | 2.0 |
| QC chart mean is __ SD from the measured mean | 1.5 |
0 |
|
The QC chart SD is ___ times the measured SD |
1.0 | 1.0 |
| The perceived Negative rule is actually | 1-1.5s |
1-2.5s |
|
The perceived Positive rule is actually |
1-4.5s |
1-2.5s |
|
Bracket QC? Verify QC BEFORE reporting? |
No |
Yes |
|
# QC Samples in each Run |
1 | 1 |
| # QC Runs / Day | 1 |
2 |
|
Front line QC Chart Review: |
2x / week |
|
| Supervisor QC Chart Review: |
1x / week |
If this QC sample protected 100 patient results per run and a process failure occurred halfway through the first of ten runs, 950 patients would be exposed to unacceptable risk and 48 would receive MURs (Medically Unreliable Results.) With a shift of 3.35 SD shift, the average cost of error would rise from $11.61 to $78.52 (based on a cost of error at TEa of $100.) This lab could prevent $73,565 in clinical care costs associated with lab error by using the QC process recommended by the risk mitigation algorithms of RiskGatorÔ software.
[i] RiskGatorÔ software – risk mitigation software from AWEsome Numbers Inc. to validate the effectiveness of existing QC processes and design QCPs verified to meet acceptable patient risk.
[1] International Organization for Standardization. ISO 31000:2018 Risk management – Guidelines. 4th ed. Geneva: ISO, 2018.
[1] CLSI EP23A. Laboratory quality control based on risk management, Wayne PA: Clinical & Laboratory Standards Institute, 2011.
[1] RiskGatorÔ software – risk mitigation software from AWEsome Numbers Inc. to validate effectiveness of existing QC processes and design QCPs verified to meet acceptable patient risk.